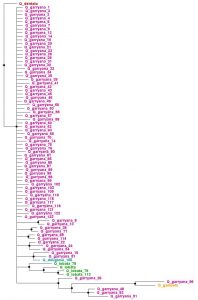
The most common use of GenBank is for phylogenetic analyses. What is phylogenetic anaysis? Phylo means a group of organisms; therefore, phylogentics is the grouping of organisms based on their genetic information, which is derived from DNA and RNA sequence data. The figure below is an example of a phylogenetic tree based on a relatively short, non-coding DNA sequence region situated in the nuclear DNA. There are nodes (black dots) that indicate a common ancestor; however, a time scale is not included in this tree, so we cannot surmise how long ago those ancestors lived. That would require further information provided from dated fossils. The length of the branches indicates the relative amount of differences occurring between each specimen. In the figure, there are two samples that are grouped together on a long branch, indicating that these individuals have more character changes (mutations) occurring in the examined sequence DNA than the other sampled individuals.
The organisms in this analysis are primarily North American white oaks (Garry oak (Quercus garryana), Valley oak (Quercus lobata), Blue oak (Quercus douglasii) and Gambel oak (Quercus gambelii)), with an Asian white oak (Quercus dentata) used as the outgroup in order to root the tree and provide a reference of relationship. There are not many differences between most Garry oak samples, but some samples show more differences between Garry oak and, others, more similarities to the other sampled NA white oaks. So what would cause this? There are two answers. The first answer being that oaks hybridize, a lot! The second answer being that the selected DNA sequence region is too conserved (does not have enough character changes a.k.a. mutations) to resolve these relationships. Or, more likely, it is the combination of these factors.

